Scheduled to Fail: How Transit Agencies Are Running Buses Nobody Rides—and What Data-Driven Tools Can Do About It

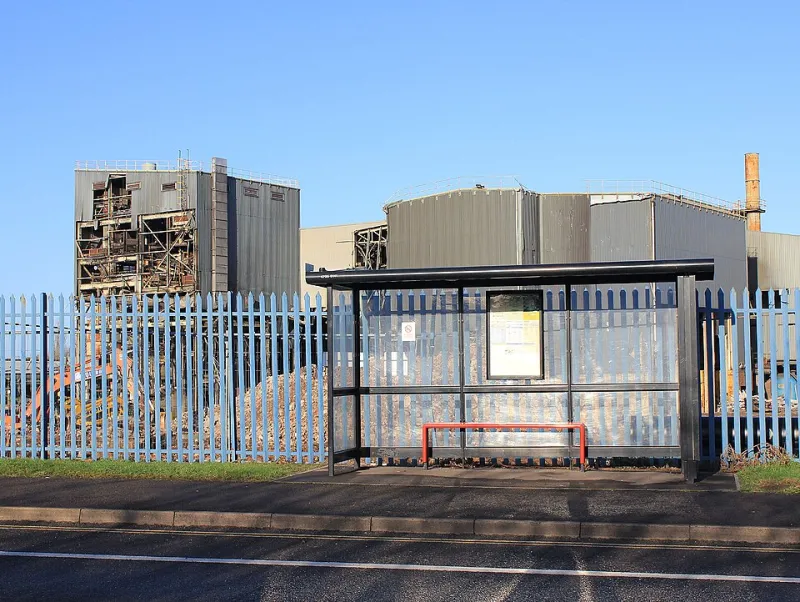
Photo: Anthony Quintano, CC BY 2.0, via Wikimedia Commons
On a Tuesday morning in a mid-sized American city, a 40-foot diesel bus departs its terminal on schedule, travels its full route, and returns to the depot having carried fewer than a dozen passengers across the entire run. Meanwhile, three miles away, a cluster of warehouse workers finishing a night shift stands at a stop on a different corridor—one that hasn't seen a scheduled bus since 6:47 a.m. Both situations represent a failure of the same underlying system: transit planning built on decades-old assumptions that no longer reflect where people live, work, or move.
This is the ghost bus problem. Not phantom vehicles that fail to show—though that issue has received its own share of coverage—but rather real, operating buses consuming real fuel and real labor hours while delivering minimal public value. The phenomenon is more widespread than most riders or taxpayers realize, and its roots run deeper than any single scheduling decision.
How Schedules Become Outdated Before the Ink Dries
Most transit agencies in the United States revise their service schedules on a fixed cycle—typically once or twice per year, sometimes less frequently. Route structures are often inherited from planning decisions made in the 1970s or 1980s, when urban employment was concentrated downtown and residential density followed predictable patterns. The data used to justify those schedules frequently comes from manual passenger counts conducted over a narrow window of time, then extrapolated across months of service.
The problem is that cities do not hold still. Employment centers migrate to suburban office parks and industrial corridors. Residential development accelerates in neighborhoods that weren't on anyone's radar during the last planning cycle. A global pandemic reshuffled commute timing entirely, flattening the traditional morning peak and introducing entirely new travel windows. Transit schedules, however, tend to lag these shifts by years.
"We're essentially flying the plane using a map that was drawn before half the terrain changed," said one regional transit planner who requested anonymity to speak candidly about internal processes. "The schedule we're operating today reflects a city that existed five years ago, not the one people are actually navigating."
The Cost of Inertia
Running underutilized routes is not merely an efficiency problem—it is a resource allocation crisis. Every hour a near-empty bus operates on a low-demand corridor is an hour of driver time, fuel expenditure, and vehicle wear that cannot be redirected to a corridor where riders are actively waiting. For agencies already operating under severe budget constraints, the compounding effect is significant.
The Federal Transit Administration's National Transit Database offers a window into this dynamic. Systemwide cost-per-passenger metrics vary enormously across agencies, and a meaningful portion of that variance can be traced to service hours deployed on routes where ridership density never justified the investment. Some agencies have quietly acknowledged the problem in internal audits, only to find that political pressure from neighborhoods reluctant to lose any bus service—regardless of utilization—makes rationalization nearly impossible through traditional processes.
The equity dimension complicates matters further. Not every low-ridership route is a waste. Some serve populations with no alternative transportation options, and any optimization framework must account for the difference between a route that is underused because demand shifted and one that is underused because the community it serves has been systematically underinvested in for decades.
Real-Time Data as a Diagnostic Tool
The emergence of automated passenger counters, GPS vehicle tracking, and fare payment systems that generate granular trip-level data has fundamentally changed what transit agencies can know about how their systems are actually being used. The challenge, increasingly, is not data collection but data utilization.
Several agencies have begun deploying analytics platforms that aggregate these streams to produce continuous ridership intelligence rather than periodic snapshots. Los Angeles Metro, which operates one of the nation's largest bus networks, has invested in tools that allow planners to examine load factors by time of day, stop by stop, across the entire system. The goal is to identify structural mismatches between scheduled service and actual demand before the next formal service change cycle—rather than after.
In Columbus, Ohio, the Central Ohio Transit Authority has piloted a demand-responsive service layer called COTA Plus in lower-density zones, allowing riders to request trips through a mobile app and receive dynamically routed service rather than fixed-schedule buses. Early results suggested meaningful improvements in both cost efficiency and rider satisfaction in zones where traditional fixed routes had chronically underperformed.
AI-Powered Optimization: Promise and Friction
Beyond analytics, a growing number of technology vendors are offering AI-driven route optimization platforms that promise to translate ridership data into actionable scheduling recommendations. Companies including Remix (now part of Via), Swiftly, and Optibus have developed tools designed to model the trade-offs between service coverage, frequency, and cost—surfacing options that human planners may not identify through manual analysis.
The technology is genuinely capable of identifying inefficiencies that would take a planning team months to uncover. But deployment has been uneven, and the barriers are instructive.
Labor agreements represent one significant constraint. Many transit worker contracts contain provisions governing minimum run lengths, split shifts, and operator assignments that limit how flexibly service can be restructured, regardless of what an optimization algorithm recommends. Technology can identify the theoretically optimal schedule; it cannot unilaterally renegotiate a collective bargaining agreement.
Procurement timelines present another obstacle. Public agencies acquiring new software platforms must navigate competitive bidding processes, IT security reviews, and integration work with legacy scheduling and dispatch systems—processes that can stretch two to three years from initial interest to operational deployment. In a technology landscape that moves quickly, that lag is consequential.
Building Systems That Learn
The most promising models emerging from current pilots share a common architecture: they treat scheduling not as a periodic exercise but as a continuous feedback loop. Service levels are adjusted incrementally based on observed demand, with changes small enough to avoid disrupting riders who depend on predictable patterns but frequent enough to track real-world shifts meaningfully.
Houston's METRO system undertook one of the most ambitious network redesigns in recent American transit history in 2015, rebuilding its entire bus network around frequency and connectivity rather than legacy geography. The redesign was informed by detailed ridership analysis and resulted in measurable ridership gains on high-frequency corridors, even as some lower-demand routes were restructured. Houston's experience demonstrated both what is possible when agencies commit to data-driven planning and how politically difficult the process of change can be.
The ghost bus problem is ultimately a symptom of systems designed for a different era operating in a fundamentally different urban environment. Fixing it requires more than better software—it requires agencies willing to act on what their data is telling them, even when that means acknowledging that the map and the territory have diverged. The tools to close that gap exist. The harder work is building the institutional will to use them.